Abstract: A car driving information processing system based on CAN bus is designed. The system records and stores the driving time, speed and various switching information of the vehicle, which not only enables data acquisition between the data acquisition unit and the data analysis software, but also draws various driving curves according to the driving information of the vehicle. The system is developed by Visual Basic. The data information query is simple and fast, the interface is beautiful, the color tone is suitable, the anti-interference ability is strong, and the work is stable and reliable.
This article refers to the address: http://
The development and popularization of the automobile industry has brought many problems to traffic management. In 2005 alone, there were 450,254 road traffic accidents across the country, resulting in 98,738 deaths and direct property losses of 8.8 billion yuan. According to analysis, driver illegal driving is the main cause of traffic accidents, including illegal speeding and fatigue driving. Objectively, there is a need for a vehicle travel state information processing system capable of real-time recording of related information such as vehicle travel and driver's driving activities, in order to curb fatigue driving, restrict driver's poor driving behavior, prevent road traffic accidents, and improve operational management. Reduce the incidence of traffic accidents and provide raw data for accident analysis and accident liability identification. Therefore, the car driving information processing system came into being.
The vehicle driving information processing system records and stores the vehicle traveling speed, time, mileage and other switching information collected by the CAN bus, and realizes functions such as query, statistics, chart generation, parameter setting and authority management, so as to analyze the vehicle driving. The state and various operations of the driver during the driving process provide a strong basis for the relevant departments to identify the responsibility of the accident.
1 System Introduction
The whole system is divided into a vehicle part and an off-board computer part. The structure diagram is shown in Figure 1. The car part is installed on the vehicle, and the data analysis software of the computer part is owned by the relevant department. The car part is mainly the CAN node and the data acquisition unit. The time, speed, switch quantity and other information collected by each CAN node are sent to the data acquisition unit of the vehicle part through the CAN bus, and then the data is passed through the RS232 of the data acquisition unit. The serial interface or USB interface is uploaded to the computer for analysis by the data analysis processing system, and the data analysis processing system also has a data downlink function, that is, initialization and parameter setting for the vehicle component.
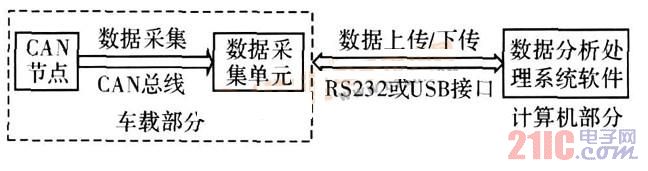
Figure 1 Schematic diagram of the car driving information processing system
2 system overall design
The overall design of the system is shown in Figure 2, divided into two parts: the lower layer and the upper layer. The lower part is mainly composed of a CAN node and a data acquisition unit attached to the CAN bus, and belongs to the vehicle part. Each CAN node consists of a sensor or actuator interface, a microprocessor, a CAN bus controller, and a CAN bus transceiver. The sensor is responsible for transmitting the collected speed, time, brakes, left and right turn signals, etc. to the microprocessor for processing, and the processed information is transmitted by the CAN controller to the CAN bus through the control CAN transceiver. The data acquisition unit is responsible for retrieving the data information on the CAN bus, and then uploading it to the upper layer data analysis software for analysis through the RS232 or U SB interface. The upper layer data analysis software part belongs to the off-board computer part, which mainly realizes statistics, generates charts, and realizes the functions of managing related information of vehicles and drivers on the data information such as the travel time and speed of the vehicle uploaded by the CAN bus.
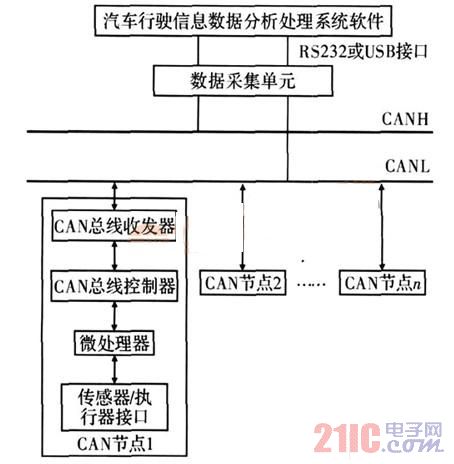
Figure 2 System structure diagram
3 system software design
The structure diagram of the car driving information processing system is shown in Figure 3, and the overall flow chart of the upper layer data analysis software is shown in Figure 4. The system is based on the SQLSever database and is developed using Visual B asic 60. The overall structure can be divided into login module, user management module, vehicle management module, data management module and help module.
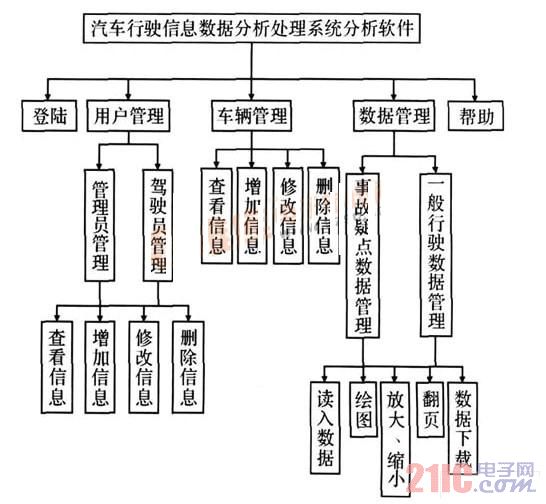
Figure 3 Structure diagram of the car driving information processing system
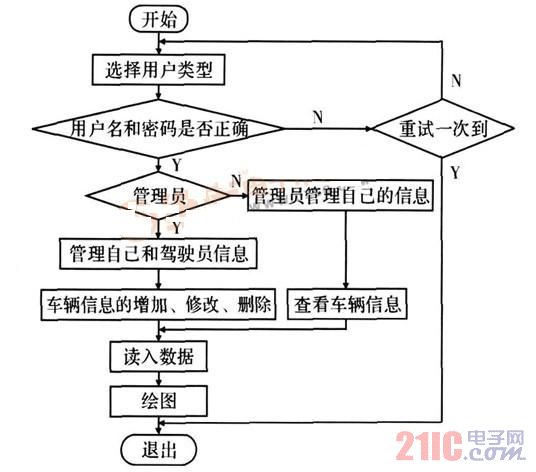
Figure 4 Overall flow chart of the upper layer data analysis software
The entire login process of the system data analysis software is divided into 4 parts:
Select the user type, enter the user number, enter the user password, and log in, and the user type refers to whether the user logging in to the system is an administrator or a driver. If the user type is selected and the correct user number and user password are entered, the system can be successfully logged in. Otherwise, you can clear the entered user number and password by clicking the Clear! button, re-enter or click the Close! button to exit the system. .
User management includes administrator management and driver management. The administrator has the highest authority, and can realize all functions in user management and vehicle management, and realizes viewing, adding, modifying, and deleting basic information such as the number, name, password, and age of the administrator and the driver. The driver can only implement some functions in user management and vehicle management, that is, view and modify his/her basic information such as name and password, and view basic information of the vehicle.
Vehicle management realizes the viewing, addition, modification and deletion of basic information such as the license plate number, brand and series of the vehicle. The focus of data analysis software is data management, which will be highlighted below.
4 Data Management
Data management includes the management of accident suspect data and the management of general driving data. It mainly draws the vehicle driving curve according to the speed of the vehicle and the amount of switching.
When the accident is suspected, it is necessary to draw information such as the time, speed and switching amount of the vehicle traveling at intervals of 0 1 s, that is, establish the relationship between speed and time, the relationship between acceleration and time, and the relationship between switch quantity and time. In general driving, it is necessary to draw information such as the time, speed and switching amount of the vehicle traveling at intervals of 1 s, that is, establish the relationship between speed and time, acceleration and time, and the relationship between switching quantity and time. The abscissa of the curve is time, the unit is s, accurate to 1 s, and the ordinate is the vehicle travel speed, acceleration and switching amount corresponding to the time. The unit of speed is km / h, accurate to 0.001 km / h, the acceleration unit is m / s2, accurate to 0.001m / s2. It can also realize the real-time query of the zoomed, reduced, paged and data on the curve drawn.
Since the speed, acceleration, etc. are continuous data, and the switching quantity is discrete data, the drawing is divided into continuous curve drawing of speed, acceleration and time and discrete curve drawing of switching quantity and time. However, the basic idea of ​​drawing a curve is to determine a straight line at two points, continuously take data, and continuously connect two points, you can draw a time-velocity relationship curve and a time-acceleration relationship curve, and the implementation method is through VB. Line method.
The data on the curve shows that the various driving information at the current time is displayed in a digital form and conforms to the graphic. When various information of a certain point is needed, the position information of the point can be obtained by the mouse up and mouse dow n events of the mouse, and then converted into various information corresponding to the point.
When the accident is suspected, the relationship between time and speed, time and acceleration when the vehicle is running is shown in Figure 5, where the solid line is the time-speed curve and the dotted line is the time-acceleration curve. For ease of analysis, the vertical axis on the left side of the graph is the velocity, and the vertical axis on the right is the acceleration.
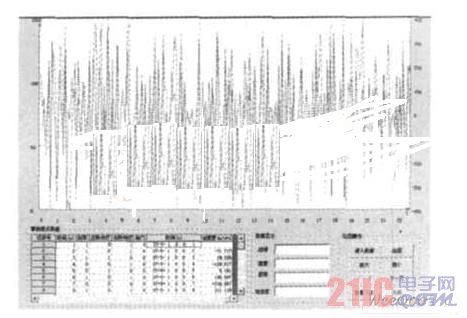
Figure 5 Time and velocity, acceleration curve when the accident is suspected
In general driving, the relationship between time and speed, time and acceleration of the vehicle is shown in Fig. 6. At the time of design, a typical switch quantity is selected as the analysis object, wherein the curves (a), (b), (c), and (d) respectively represent the brake, the left turn signal, the right turn signal, and the throttle.
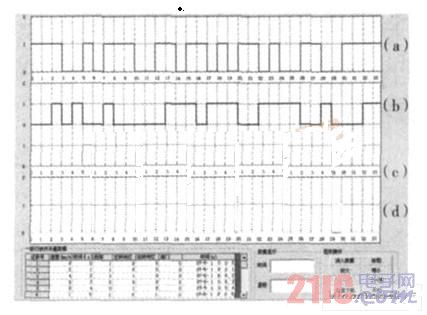
Figure 6 Curve of general time versus switch
5 Conclusion
Compared with the general vehicle driving information processing system, the system optimizes the storage of vehicle driving information, can store more and more detailed vehicle driving information with limited storage space, and realizes data collection based on VB environment. When drawing the vehicle driving curve, the system puts the time-speed relationship curve and the time-acceleration relationship curve together, whether it is the accident suspect or the general driving, and realizes the accurate positioning and display of the data on the curve, which is convenient for analysis. The personnel analyze the condition of the vehicle while driving.
IPhone 8 Plus Tempered Glass is especially designed to
fit the iPhone 8 plus screen perfectly. It can protect your iPhone 8 Plus screen
from drops, bumps, scratches and scrapes, and protect your iPhone effectively
against any scratches on the screen. Screen Guard provides
super smooth touching as well as no lose in touch screen sensitivity, also with
maximum protection. 2.5D or 3D rounded
edge can touch smooth and will not hurt you when using your phone.
Description of iPhone 8 Plus Tempered Glass
Size: 5.5 inch
For iPhone 8 Plus
Material: Corning, Schott or AGC
Radian: 2.5D / 3D
Technology: Clear / Anti glare / Anti blue light / Privacy / Printing
MOQ: 1K pieces
Packaging: Standard export package or Customized
Payment: T/T, L/C, Others
Delivery: In Shenzhen CHINA, 2.5D: 7-10 working days / 3D: 15-20
working days after your payment
FAQ:
Q1: Are you a trading company or manufacturer?
---A: We are distributor located in Shenzhen, China.
Q2: Is the sample free?
---A: Yes, the free sample will be sent for your evaluation!
Q3: What is the production lead time?
---A: 2.5D: 7-10 working days / 3D: 15-20 working days after your payment.
Q4: Do you inspect all your goods before delivery?
---A: Yes, we have 100% inspect before delivery.
Welcome to make inquiry !
IPhone 8 Plus Tempered Glass
Iphone 8 Plus Tempered Glass,Anti Blue Light Tempered Glass,White Iphone 8 Plus Tempered Glass,Hd Tempered Glass For Iphone 8 Plus
Shenzhen Kantou IM Technology Co., Ltd. , http://www.kantou-im.com