The sensing element converts the relevant physical quantity into an electrical signal. The common output characteristic of a sensing element is non-linear, ie the output of the sensing element does not vary linearly with changes in the associated physical quantities. This non-linearity can lead to inaccurate measurements and errors. This paper mainly introduces the method of correcting the nonlinear problem in the linear variable differential transformer (LVDT) positioning sensor, which is suitable for many applications such as automotive hydraulic valve positioning sensing. In addition, the content discussed in this article is also suitable for other types of automotive sensor applications such as ultrasonic parking assistance.
Sensors that support high frequency outputThe electrical signals produced by many sensing elements are relatively high frequency signals. This is because the excitation signal of the sensing element is a high frequency signal and because the physical quantity being measured is of high frequency in nature. A typical example is the positioning of an automotive hydraulic valve using an LVDT positioning sensor. The reason why this sensor is of high frequency is that the LVDT primary coil is excited by a high frequency signal such as 5KHz. Similarly, the piezoelectric transmitter output used in ultrasonic parking assist applications is also high frequency because the transmitter measures ultrasonic intensity and its signal frequency is greater than 20KHz.
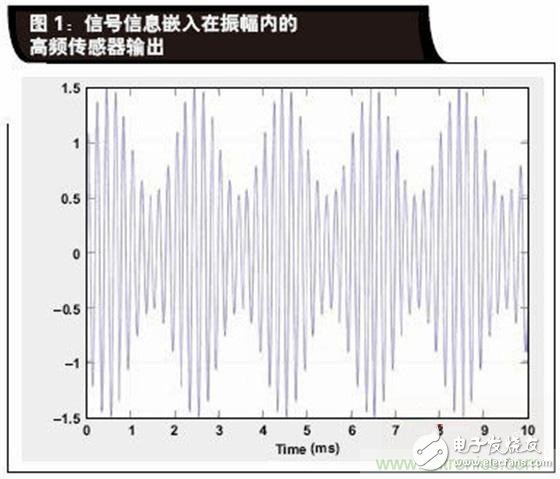
In the case of a sensor outputting a high frequency signal, the signal information is usually mostly embedded in the amplitude of the signal. Figure 1 is a time plot of the high frequency sensor signal, and the amplitude represents the physical quantity change measured by the sensor. The mathematical expression of this signal is:
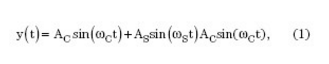
Where AC is the excitation amplitude of the sensor, ωC is the excitation frequency of the sensor in radians per second, AS is the amplitude of the physical quantity to be measured, and ωS is the frequency of the physical quantity to be measured in radians per second.
Assuming that the amplitude of the wanted signal is less than the amplitude of the high frequency carrier signal, then y(t) is the amplitude modulated signal without distortion.
Note that in some cases, signal information can also be embedded in the frequency of the signal. For example, if a moving car needs to measure the distance to another moving vehicle using a bumper or an ultrasonic transmitter in the mirror, the frequency of the signal will provide information about the relative speed of the vehicle based on the Doppler effect.
The focus of this paper is on how to extract amplitude information from the output of a high frequency sensor. The technique of extracting amplitude information is also referred to as amplitude demodulation.
Since the advent of AM radio transmissions at the beginning of the last century, amplitude demodulation technology has existed. Whether in the analog or digital domain, there are numerous solutions for extracting amplitude information from the signal. In addition, the demodulation process can not only extract the amplitude of the signal, but also extract the phase information of the sensor output signal relative to the sensor excitation. The former demodulation technique is called asynchronous demodulation, and the latter technique is called synchronous demodulation.
According to the above definition, the focus of this paper will be limited to a specific amplitude-extraction technology category, namely digital asynchronous amplitude demodulation.
Why is this small class of technology crucial? With the advent of advanced manufacturing technologies for mixed-signal integrated circuits (ICs) such as the Texas Instruments LBC8LV process, we can use a mixed-signal signal processor to support all types of sensors. With such sensors, part of the signal conditioning takes place in the analog domain and part in the digital domain. While signal conditioning architectures have quantified capabilities, if properly designed, these devices offer flexibility and provide sufficient accuracy for most sensor applications. Application engineers can easily customize their signal conditioners for their specific application scenarios, speeding up their product development.
TI's PGA450-Q1 is a typical example of a mixed-signal signal conditioner that can be used in automotive sensors used in ultrasonic parking assist applications. Specifically, the signal conditioner first uses an amplifier to amplify the electrical signal, and then uses digital asynchronous amplitude demodulation techniques to extract the signal amplitude.
Digital asynchronous amplitude demodulationTwo methods of digital asynchronous amplitude demodulation are discussed: peak method and mean method.
Peak method
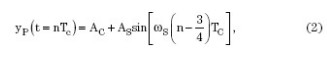
In the present asynchronous demodulation method, the peak value of the sensor output signal for each frequency cycle can be extracted, that is, the process will discriminate the signal in time at the frequency of the underlying carrier signal.
If we already know the frequency of the underlying signal (which is usually the case), and if the signal is sinusoidal (this is a typical high frequency excitation signal), then the extracted peak is the amplitude of the sine wave in each cycle. That is to say, the peak value of the nth carrier frequency period can be expressed as the following mathematical expression:
The PGA450-Q1 can implement peak demodulation.
Mean method
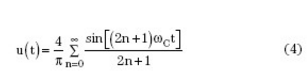
When asynchronous demodulation is used, the sensor signal can be rectified first. The rectified output is then filtered using a low pass filter. The full-wave rectified output of the signal described in Equation 1 is expressed mathematically as:
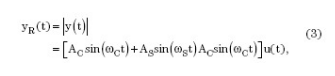
Where u(t) is a square wave with an amplitude equal to 1 and a frequency equal to ωC.
Therefore, the rectified output can be expressed as:
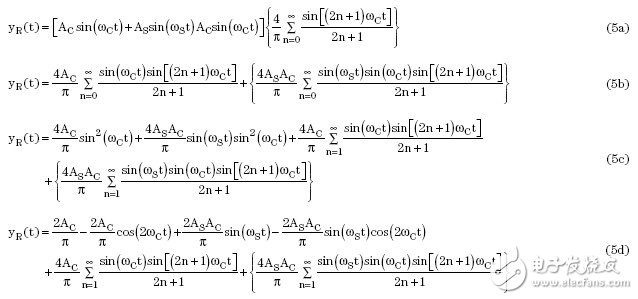
The rectified output is then filtered using a low pass filter with a gain of 0 dB and a cutoff frequency of ω C. The filtered output can be expressed as:
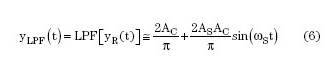
Equation 6 indicates that this method can be used to extract the signal.
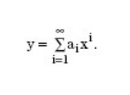
Nonlinear influenceIn a linear system, the output of the system is proportional to the input, in other words, the output is:
Where x is the system input, y is the system output, and ai is the coefficient. To simplify the analysis, the offset term (the item that is unrelated to the input signal) can be ignored.
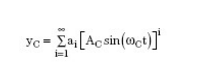
In a nonlinear system, the output of the system contains high-order inputs, ie the output is:
Specifically for the LVDT signal conditioning, the amplitude modulated signal given in Equation 1 may be affected by nonlinearities. Possible causes of non-linearity include:
1. The drive signal is distorted, or the carrier has higher order harmonics. The reason why the carrier contains higher order harmonics is that the carrier signal itself is the output of the nonlinear system:
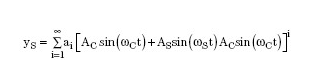
2. The nonlinear signal chain, or signal output, is non-linear with respect to its input:
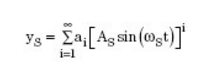
3. The output of a nonlinear transmitter, or transmitter, is non-linear with respect to the physical quantity it measures:
Note that the first two non-linear sources are the result of a poorly performing signal generator/regulator, while the third non-linear source is caused by the transmitter.
In addition, all of the above non-linearities may exist simultaneously in the system, making the output of the signal chain mathematically complex.
  
Power Thermistor
Power NTC Thermistor has strong power and strong capability of surge current protection. It has big material constant (B value) and small remain resistance as well.
With the properties of fast response, high reliability and long service life, this type of thermistor has a full and wide application range which can be used in conversion power supply, switch power, UPS power, electronic energy saving lamp, electronic ballast, electric heater, CRT and illumination lamp.
Power Thermistor,Material Constant,Temperature Controller,Oven Thermistor
Feyvan Electronics Technology Co., Ltd. , https://www.fv-cable-assembly.com